Introduction
Currently there is no easy way of creating a filled contour map using the great leaflet.js python library folium. I really enjoy the interactive maps from folium with the ease of use of python, but in this case the functionality was not implemented yet. I have created an issue on github and the feature might be a part of a later release.
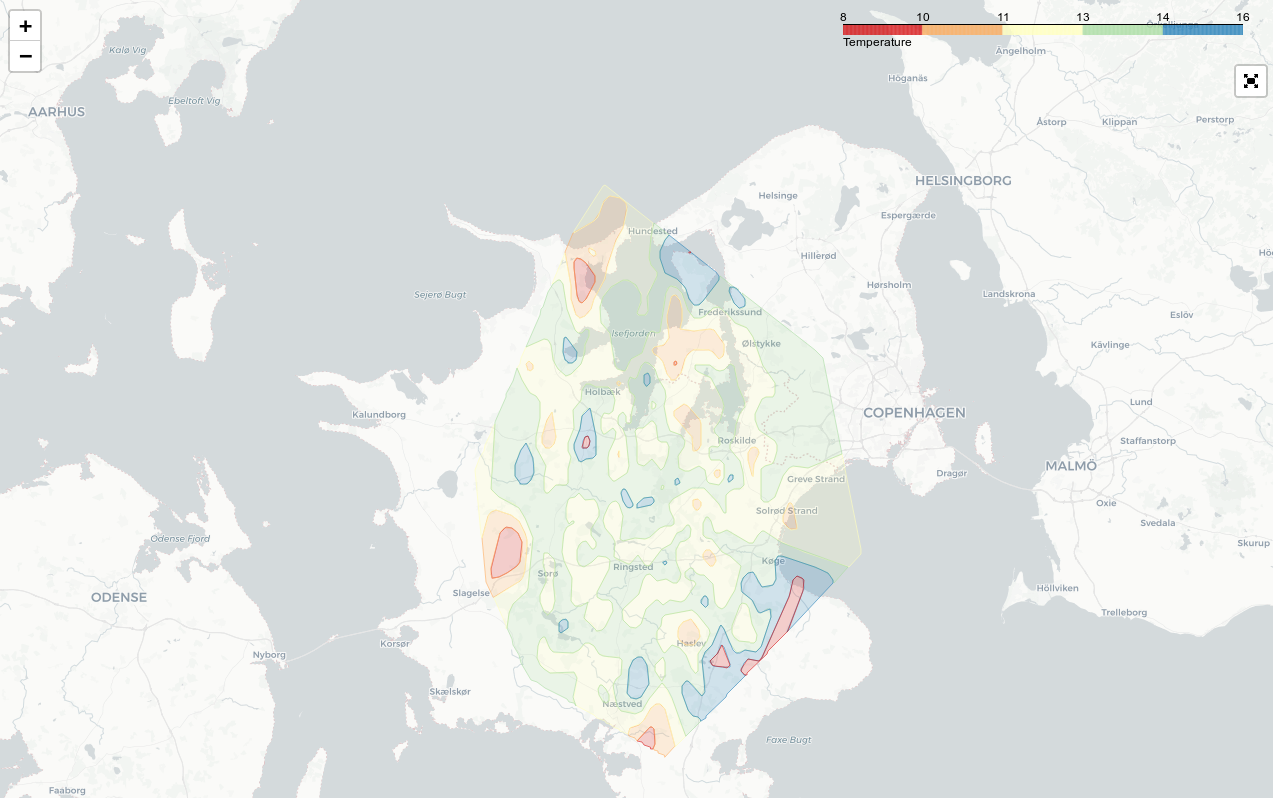
For now I have created a workaround as seen below which is a bit long, but does makes it fairly easy to make an interactive map overlain with colored contours.
#!/usr/bin/env python
# -*- coding: utf-8 -*-

import numpy as np
import pandas as pd
import folium
import branca
from folium import plugins
import matplotlib.pyplot as plt
from scipy.interpolate import griddata
import geojsoncontour
import scipy as sp
import scipy.ndimage

# Setup
temp_mean = 12
temp_std  = 2
debug     = False

# Setup colormap
colors = ['#d7191c',  '#fdae61',  '#ffffbf',  '#abdda4',  '#2b83ba']
vmin   = temp_mean - 2 * temp_std
vmax   = temp_mean + 2 * temp_std
levels = len(colors)
cm     = branca.colormap.LinearColormap(colors, vmin=vmin, vmax=vmax).to_step(levels)

# Create a dataframe with fake data
df = pd.DataFrame({
    'longitude':   np.random.normal(11.84,     0.15,     1000),
    'latitude':    np.random.normal(55.55,     0.15,     1000),
    'temperature': np.random.normal(temp_mean, temp_std, 1000)})

# The original data
x_orig = np.asarray(df.longitude.tolist())
y_orig = np.asarray(df.latitude.tolist())
z_orig = np.asarray(df.temperature.tolist())

# Make a grid
x_arr          = np.linspace(np.min(x_orig), np.max(x_orig), 500)
y_arr          = np.linspace(np.min(y_orig), np.max(y_orig), 500)
x_mesh, y_mesh = np.meshgrid(x_arr, y_arr)

# Grid the values
z_mesh = griddata((x_orig, y_orig), z_orig, (x_mesh, y_mesh), method='linear')

# Gaussian filter the grid to make it smoother
sigma = [5, 5]
z_mesh = sp.ndimage.filters.gaussian_filter(z_mesh, sigma, mode='constant')

# Create the contour
contourf = plt.contourf(x_mesh, y_mesh, z_mesh, levels, alpha=0.5, colors=colors, linestyles='None', vmin=vmin, vmax=vmax)

# Convert matplotlib contourf to geojson
geojson = geojsoncontour.contourf_to_geojson(
    contourf=contourf,
    min_angle_deg=3.0,
    ndigits=5,
    stroke_width=1,
    fill_opacity=0.5)

# Set up the folium plot
geomap = folium.Map([df.latitude.mean(), df.longitude.mean()], zoom_start=10, tiles="cartodbpositron")

# Plot the contour plot on folium
folium.GeoJson(
    geojson,
    style_function=lambda x: {
        'color':     x['properties']['stroke'],
        'weight':    x['properties']['stroke-width'],
        'fillColor': x['properties']['fill'],
        'opacity':   0.6,
    }).add_to(geomap)

# Add the colormap to the folium map
cm.caption = 'Temperature'
geomap.add_child(cm)

# Fullscreen mode
plugins.Fullscreen(position='topright', force_separate_button=True).add_to(geomap)

# Plot the data
geomap.save(f'data/folium_contour_temperature_map.html'

For people looking to make time series animation of contour plots, the code can be found here:
https://github.com/samirak93/snow/blob/master/Complete_Notebook.ipynb
Thank you this is helpful. For a project I want to use folium to create contour plots.
How would I add a geojsontooltip for the temperature data? I would like to see a sample when I hover over the contours.
Thanks for this very useful workaround. A little comment: In order for the opacity setting to actually work, you need to replace “opacity” by “fillOpacity” in the style_function. (Maybe that’s something that changed in leaflet.js, just posting it here to prevent other people from having to search why the opacity isn’t quite working). Thanks again.