Introduction
Pandas is a powerful data manipulation library in Python, and its groupby function is a handy tool for aggregating data based on specific criteria. However, when it comes to estimating the uncertainty around aggregated values, it might be beneficial to go beyond the basic functionality. In this short guide, I’ll explore how to augment pandas groupby output by adding bootstrapped estimates of the mean, effectively providing confidence intervals for your grouped data.
Bootstrapping
Bootstrapping is a resampling technique that can be used to estimate the distribution of a statistic by repeatedly sampling with replacement from the observed data. This can be particularly useful when trying to understand the uncertainty associated with aggregated statistics, such as the mean. Further reading: https://en.wikipedia.org/wiki/Bootstrapping_(statistics)
Applying a custom function to pandas groupby
To integrate bootstrapped estimates of the mean into your Pandas groupby workflow, I have defined a custom function that leverages the power of bootstrapping.
First, I will import some libraries and create a mock dataframe that I can demonstrate the function with
import pandas as pd
import seaborn as sns
import tqdm
import random
from datetime import datetime
import tqdm
import numpy as np
from scipy.stats import sem
from sklearn.utils import resample
import matplotlib.pyplot as plt
sns.set_style("darkgrid")

# Create a mock dataframe with two categorical columns and one scoring column
random.seed(42)
num_rows = 3500

data = {
    "A": [random.choice(["lorem", "ipsum", "dolor"]) for _ in range(num_rows)],
    "B": [random.choice(["foo", "bar"]) for _ in range(num_rows)],
    "score": [random.randint(1, 5) for _ in range(num_rows)],
}
df = pd.DataFrame(data)
df.head()
this yields a dataframe of the following form:
A   B   score
0   dolor   foo 5
1   lorem   bar 3
2   lorem   bar 2
3   dolor   bar 2
4   ipsum   foo 2
Now for the actual implementation of the code
def calc_mean_count_ci(_df, groupby_cols=None, stat_col=None, n_bootstrap=1000, save_to_file=False):
    """
    Calculate mean, count, and confidence intervals using bootstrapping.

    Parameters:
    - _df (DataFrame): Input DataFrame containing the data.
    - groupby_cols (list, optional): List of columns to group the data by. Default is None.
    - stat_col (str, optional): Column name for which to calculate mean, count, and confidence intervals.
    - n_bootstrap (int, optional): Number of bootstrap samples to generate. Default is 1000.
    - save_to_file (bool, optional): If True, save the results to a CSV file. Default is False.

    Returns:
    - DataFrame: A DataFrame containing mean, count, and confidence interval information
                 for the specified groupby columns and statistical column.

    Example:
    >>> result_df = calc_mean_count_ci(df, ['A', 'B'], 'score')

    Notes:
    - The function utilizes bootstrapping to estimate the confidence interval for the mean.
    - The result DataFrame includes columns for count, mean, and confidence intervals.
    - If save_to_file is True, the result is saved to a CSV file with a filename based on the current date,
      groupby columns, statistical column, and the term 'mean_count_ci'.
    """

    # Define a function to calculate confidence interval using bootstrapping
    def calculate_ci_bootstrap(data):
        means = []
        for _ in range(n_bootstrap):
            sample = resample(data)  # Bootstrap resampling
            mean = np.mean(sample)  # Calculate mean of the resampled data
            means.append(mean)

        # Calculate the mean of the whole dataset and the confidence interval
        # from the distribution of the sample means
        data_mean = np.mean(data)
        confidence_interval = np.percentile(means, [2.5, 97.5])

        return pd.DataFrame({
            'count': [len(data)],
            'mean_ci_lower': [confidence_interval[0]],
            'mean': [data_mean],
            'mean_ci_upper': [confidence_interval[1]],
        }).round(4)

    # Group by columns A and B, apply the calculate_ci_bootstrap function to
    # the 'score' column, and merge the results
    result = (
        _df.groupby(groupby_cols)[stat_col]
        .apply(calculate_ci_bootstrap)
        .reset_index()
        .drop(columns=["level_2"])
    )

    # Save the data to a file with the current date, columns and basic info the dataframe
    if save_to_file:
        name = f'{datetime.now().date().isoformat()}-{"-".join(groupby_cols)}-{stat_col}-mean_count_ci.csv'
        result.to_csv(name, index=False)
        print(f'Saved data to {name}')

    return result

calc_mean_count_ci(df, ['A', 'B'], 'score')
which yields
A   B   count   mean_ci_lower   mean    mean_ci_upper
0   dolor   bar 605 2.7933  2.9041  3.0117
1   dolor   foo 591 2.8967  3.0152  3.1286
2   ipsum   bar 584 2.9829  3.0993  3.2072
3   ipsum   foo 608 2.7878  2.8980  3.0066
4   lorem   bar 548 2.8814  3.0036  3.1241
5   lorem   foo 564 2.8741  2.9894  3.1046
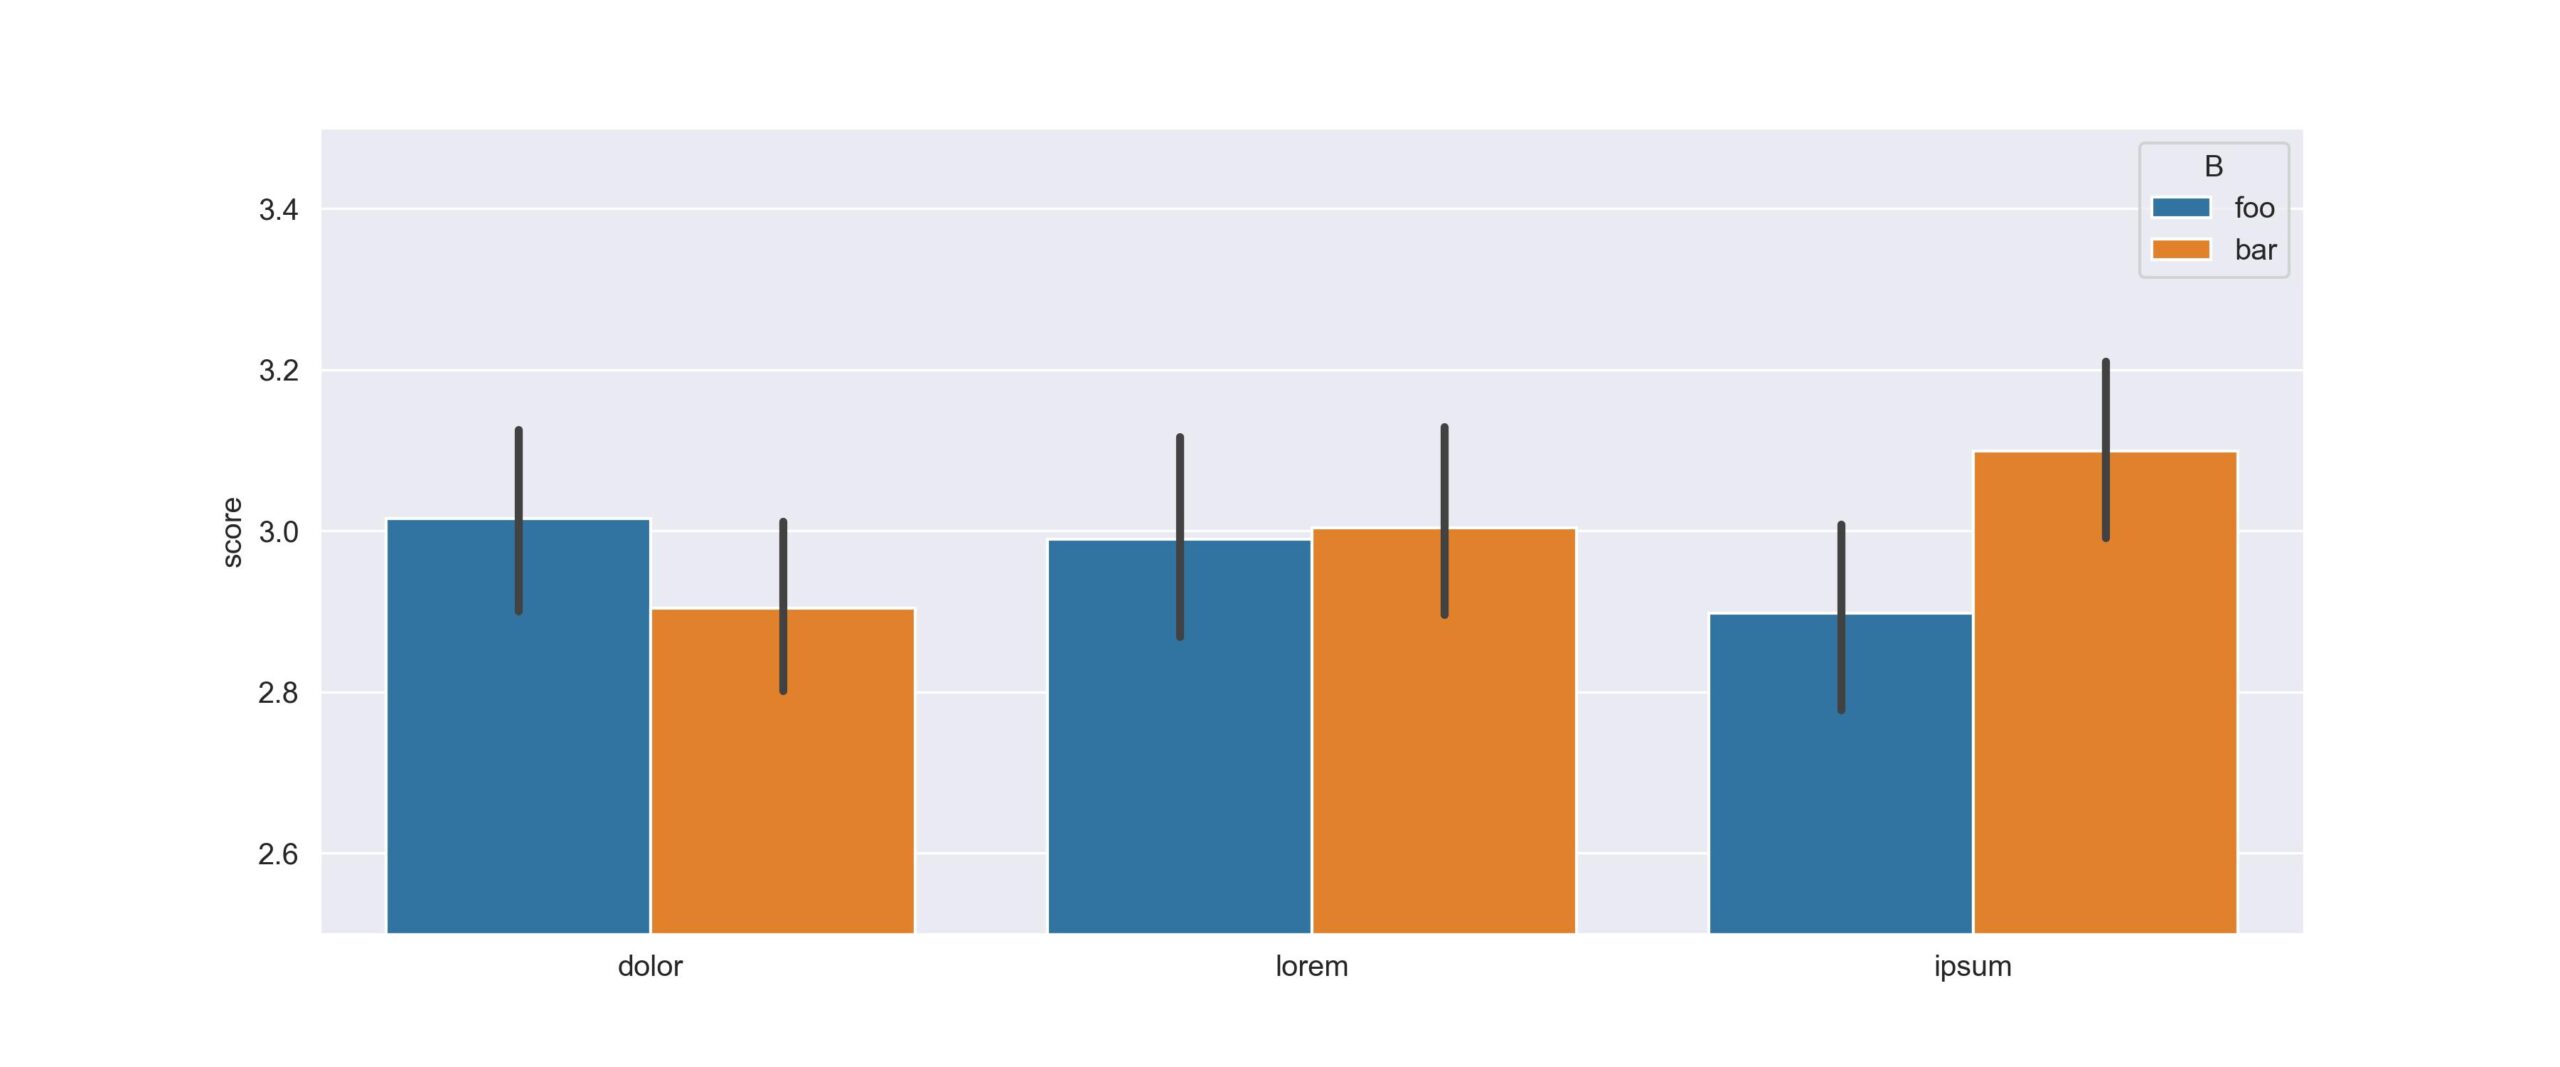
Validating the results with plots using seaborn
While the current approach offers a meticulous method for calculating confidence intervals, it proves beneficial when precise numerical values are required. However, if the sole purpose is visualization, I recommend considering Seaborn. Seaborn is a Python data visualization library built on Matplotlib, offering a high-level interface for creating visually appealing and informative statistical graphics.
fig, ax = plt.subplots(figsize=(12, 5))
sns.barplot(data=df, y="score", x="A", hue="B", ax=ax)
ax.set_xlabel("")
ax.set_ylim([2.5, 3.5])
plt.savefig(f"bootstrap_example_dataset_size_{num_rows}.jpg", dpi=300)

Regression toward the mean
By running the notebook for different values of num_rows we can see the effect of the size of the dataset on the estimates and confidences intervals. There are two observations to be made:
- If did not use confidence intervals in the plots we could easily have made wrong conclusions about scores of the different groups
- As the dataset grows in size, the estimated values are much less impacted by the individual contributions and both the confidence intervals and the increasingly focus on the value 3.
Below are plots at dataset sizes of 350, 35.000 and 3.500.000 rows.
350

35.000

3.500.000

Conclusion
By incorporating bootstrapped estimates of the mean into your Pandas groupby workflow, you can gain valuable insights into the uncertainty around aggregated values. This simple yet effective approach allows you to enhance your data analysis toolkit and make more informed decisions when working with grouped data in Pandas.
